
Top 10 Data Visualization Platforms to Unlock Actionable Insights
Raw information alone does not drive results. The ability to transform data into something people can instantly understand and act on is a true game-changer. That is where data visualization platforms shine. They turn spreadsheets and databases into beautiful, interactive visuals that allow you to ask better questions and find better answers.
But let’s be honest. Lists are boring unless they tell a story. So, this is not just a rundown of tools. Think of it as a guided tour through a landscape of modern analytics solutions. We will highlight what each platform excels at, who should use it, and how it fits into the broader world of data storytelling.

1. Tableau: The Storyteller’s Favourite
Tableau is often the first name that comes to mind when people think of data visualization. Its sleek, intuitive interface and dynamic visuals have made it a staple in enterprises and startups alike. Tableau thrives on storytelling, helping users go beyond numbers to create meaningful narratives from data.
What makes it special:
Intuitive drag-and-drop interface
Rich storytelling features for guided data exploration
Robust support for multiple data sources
Ideal for: Analysts and business users who want elegant, high-impact dashboards
Bonus: Offers extensive community resources and templates to accelerate learning
2. Power BI: Seamless for Microsoft Users
Power BI brings analytics to the masses through tight integration with Microsoft products. It lowers the barrier to entry for organizations already using Excel and Teams by providing powerful tools in a familiar environment. Its user-friendly features make complex analytics accessible to everyone.
Why users love it:
Deep integration with Excel, Azure, and Teams
Strong AI-assisted visual insights
Competitive pricing with enterprise-level capabilities
Best for: Organizations already embedded in the Microsoft ecosystem
Pro tip: Use Power BI’s natural language Q&A feature to explore data conversationally
3. Looker: Governed & Embedded Analytics
Looker is designed for teams that crave consistency and governance across their data workflows. Rather than simply visualizing results, Looker emphasizes modelling data with precision and embedding those models into workflows. It shines in environments where trust and collaboration matter.
Why it stands out:
Uses LookML for consistent data modelling across teams
Allows embedding dashboards into apps or portals
Emphasizes data governance and collaboration
Perfect for: Mid to large companies that need controlled, scalable insights
Highlight: Tight integration with Google Cloud post-acquisition
4. Qlik Sense: Exploration Without Limits
Qlik Sense empowers users to explore their data in unexpected ways. Its associative engine breaks away from the rigid structure of traditional dashboards and invites curiosity. Qlik encourages users to make discoveries by following hunches and highlighting hidden relationships.
Key benefits:
Unique associative engine allows fluid data exploration
Users can explore relationships not defined by linear dashboards
Strong self-service analytics experience
Use case: Great for discovery-driven analysis in dynamic environments
Differentiator: Click any point in your data to pivot the entire perspective instantly
5. Domo: Built for Speed & Collaboration
Domo is a cloud-native platform built with the speed of modern business in mind. It combines the ability to connect data from virtually anywhere with tools for team collaboration, making it ideal for organizations that value agility and mobility in decision-making.
Why it stands out:
Combines ETL, warehousing, and visualization in one cloud platform
Mobile-first design for execs on the go
Built-in collaboration tools like alerts and messaging
Suited for: Agile teams that prioritize fast insights and sharing across departments
Edge: Delivers BI as a service, reducing reliance on IT
6. Sisense: Embedded Analytics with a Developer Edge
Sisense is engineered for developers who want complete control over the analytics experience. It is especially strong when embedding insights into software products. With a flexible API and scalable architecture, Sisense brings analytics where users need them most.
Strengths:
Highly customizable and API-friendly
Designed for embedding analytics into SaaS products
Handles massive datasets with fast performance
Target audience: Developers and product teams building data-driven apps
Unique angle: Back-end flexibility lets you own the analytics experience end to end
7. Zoho Analytics: Smart Insights for SMBs
Zoho Analytics packs a lot of punch for its price point, making it an attractive option for small to medium-sized businesses. With automation, forecasting, and an AI-powered assistant, it simplifies analytics while offering serious capabilities.
Why choose it:
Affordable without sacrificing core features
AI assistant Zia helps generate visualizations from natural queries
Includes automation and forecasting tools
Ideal for: Small to medium businesses looking for value and simplicity
Fun fact: Integrates easily with Zoho’s full business suite, creating a seamless stack
“Numbers have an important story to tell. They rely on you to give them a clear and convincing voice.”
8. Google Data Studio: Free & Familiar
Google Data Studio lowers the cost of entry to data visualization with its fully free, cloud-based platform. Perfect for marketers and small teams, it brings Google’s signature simplicity to dashboards, while still being surprisingly powerful.
Advantages:
Totally free to use
Easy to share and collaborate in real time
Integrates directly with Google Analytics, Ads, and Sheets
Recommended for: Digital marketers, small teams, and beginners
Quick win: Build your first report in minutes using existing Google templates
9. Chartio: Visual SQL for Flexible Teams
Chartio bridges the gap between SQL-savvy users and non-technical stakeholders. With the ability to toggle between drag-and-drop visuals and SQL editing, it creates a shared space for collaboration. It is fast, lightweight, and focused on team flexibility.
Great because:
Combines drag-and-drop charts with editable SQL queries
Enables both technical and non-technical users to work together
Streamlined interface for mixing multiple data sources
Best fit: Teams that need flexible querying and visual storytelling without friction
Note: Recently acquired by Atlassian, future changes may enhance integration with project tools
10. Apache Superset: Open Source Power
Apache Superset offers power users the chance to build their own tailored data environments. It is open-source, fast, and highly extensible. For companies with strong internal development capabilities, Superset can provide a cost-effective and deeply customizable solution.
What sets it apart:
Open-source and highly customizable
Built for performance at scale
Great for technical teams wanting full control over their stack
Use case: Ideal for companies with in-house devs or data engineers
Power move: Use it to create tailored analytics solutions without recurring software costs
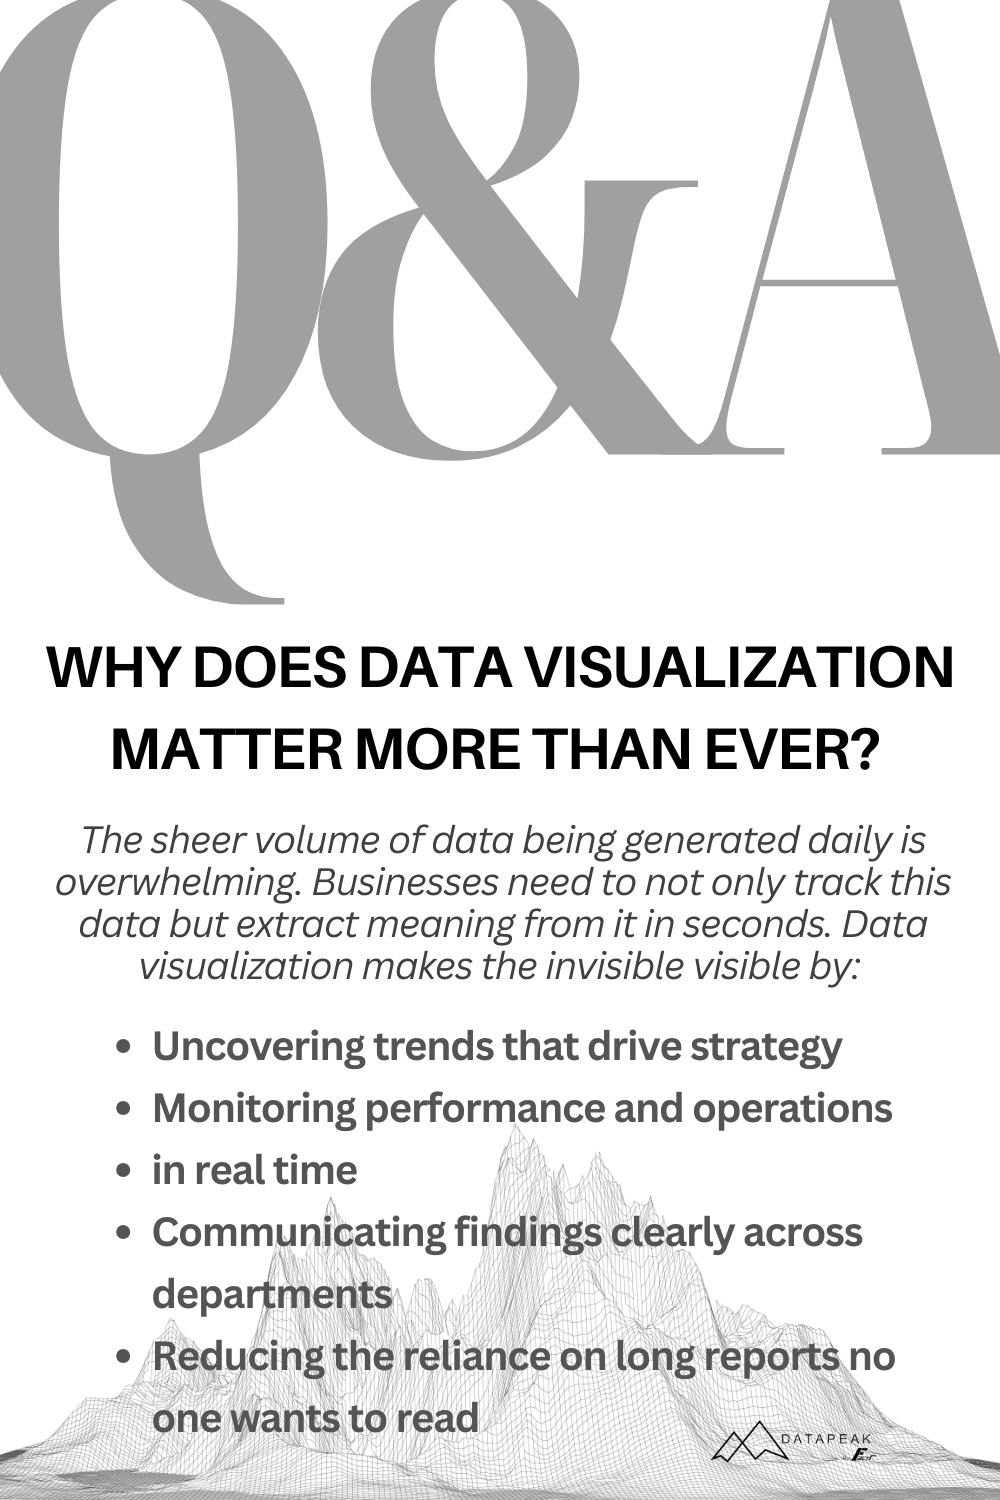
Why Does Data Visualization Matter More Than Ever?
The sheer volume of data being generated daily is overwhelming. Businesses need to not only track this data but extract meaning from it in seconds. Data visualization makes the invisible visible by:
Uncovering trends that drive strategy
Monitoring performance and operations in real time
Communicating findings clearly across departments
Reducing the reliance on long reports no one wants to read
Whether you are a data scientist, a marketing manager, or a founder juggling multiple dashboards, the right tool saves time and reveals hidden opportunities.
Now, let’s dive into the top ten data visualization platforms you should be paying attention to.
How to Choose the Right Platform for Your Needs
Choosing a data visualization platform should not feel like choosing a new gym where you will only visit once a month. Here’s a quick cheat sheet:
Want stunning dashboards with minimal code? Go with Tableau or Power BI
Need embedded analytics or custom apps? Choose Sisense or Looker
Working with limited budget and big expectations? Try Google Data Studio or Zoho Analytics
Have complex data and skilled developers? Superset or Qlik Sense will fit
User Type Recommendation Chart
User Type
Data Analysts
Developers and Engineers
Small Business Owners
Enterprise BI Teams
Product Managers (Embedded BI)
Marketers and Digital Teams
Startup Founders
Finance and Ops Teams
Non-Technical Stakeholders
Mobile-First Executives
Academic Researchers
Agencies and Consultants
Recommended Platforms
Tableau, Qlik Sense, Power BI
Apache Superset, Sisense, Looker
Zoho Analytics, Google Data Studio
Power BI, Looker, Tableau, Domo
Sisense, Looker, Superset
Google Data Studio, Zoho Analytics, Power BI
Zoho Analytics, Chartio, Superset
Power BI, Tableau, Qlik Sense
Tableau, Power BI, Google Data Studio
Domo, Power BI, Zoho Analytics
Apache Superset, Tableau Public, Google Data Studio
Tableau, Qlik Sense, Chartio
Trends Shaping the Future of Data Visualization
Platforms are rapidly evolving. Watch for these transformative trends:
Real-time dashboards that adjust with every click
Natural language querying so anyone can explore data
Predictive visualizations combining AI with historical data
Interactive data apps that blur the line between insights and action
Tomorrow’s dashboards won’t just tell you what is happening, they’ll tell you what to do next.
Your data has a story to tell, and visualization is the language it speaks. Whether you’re searching for something lean and intuitive or a full-stack analytics powerhouse, the right platform will empower you to make smarter choices, faster.
Take your time to explore. Test a few platforms. Get your hands dirty. Because once you see what your data is really saying, you will never look at a spreadsheet the same way again.

Keyword Profile: Data Visualization Platforms, AI-Powered Business Tools, Data Management, No-Code, Workflow Automation, Agentic AI, AutoML, Machine Learning, AI, DataPeak by FactR