
Dashboards That Do More: Turning Data Into Action with DataPeak
Why Dashboards Matter in AI-Powered Workflows
Dashboards are more than colorful charts, they’re the heartbeat of decision-making. For industries like manufacturing, automotive, or the public sector, the ability to see, understand, and act on data in real time can mean the difference between leading innovation or becoming the next cautionary tale.
Traditional BI dashboards often stop at reporting. They present information but leave the burden of interpretation and action on already-overloaded teams. The DataPeak dashboard is different. It’s not just a reporting layer, it’s a no-code, agentic AI-powered workspace that connects insights directly to workflows.
In this walkthrough, we’ll explore how DataPeak dashboards empower admins and users with visibility, customization, and action-ready intelligence.
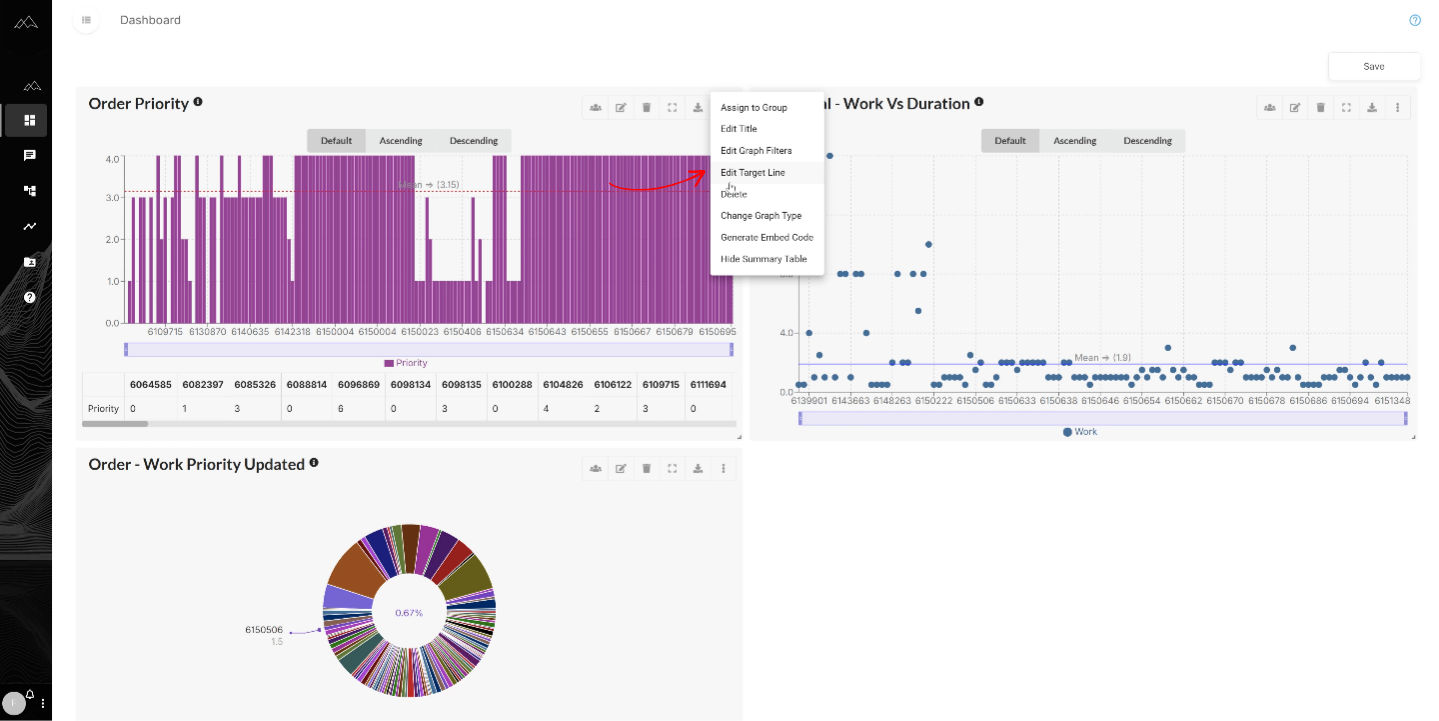
Admin Dashboards: Complete Visibility and Control
For admins and sub-admins, dashboards serve as a command center:
View all system graphs across the platform.
Reassign graphs to different permission hierarchies.
Rename, delete, or modify graph filters.
Set targets and thresholds for performance monitoring.
In public sector settings, this enables central oversight of critical workflows without exposing sensitive data to every team member. In manufacturing, plant managers gain the ability to track production KPIs across multiple lines or facilities, all from a single pane of glass.

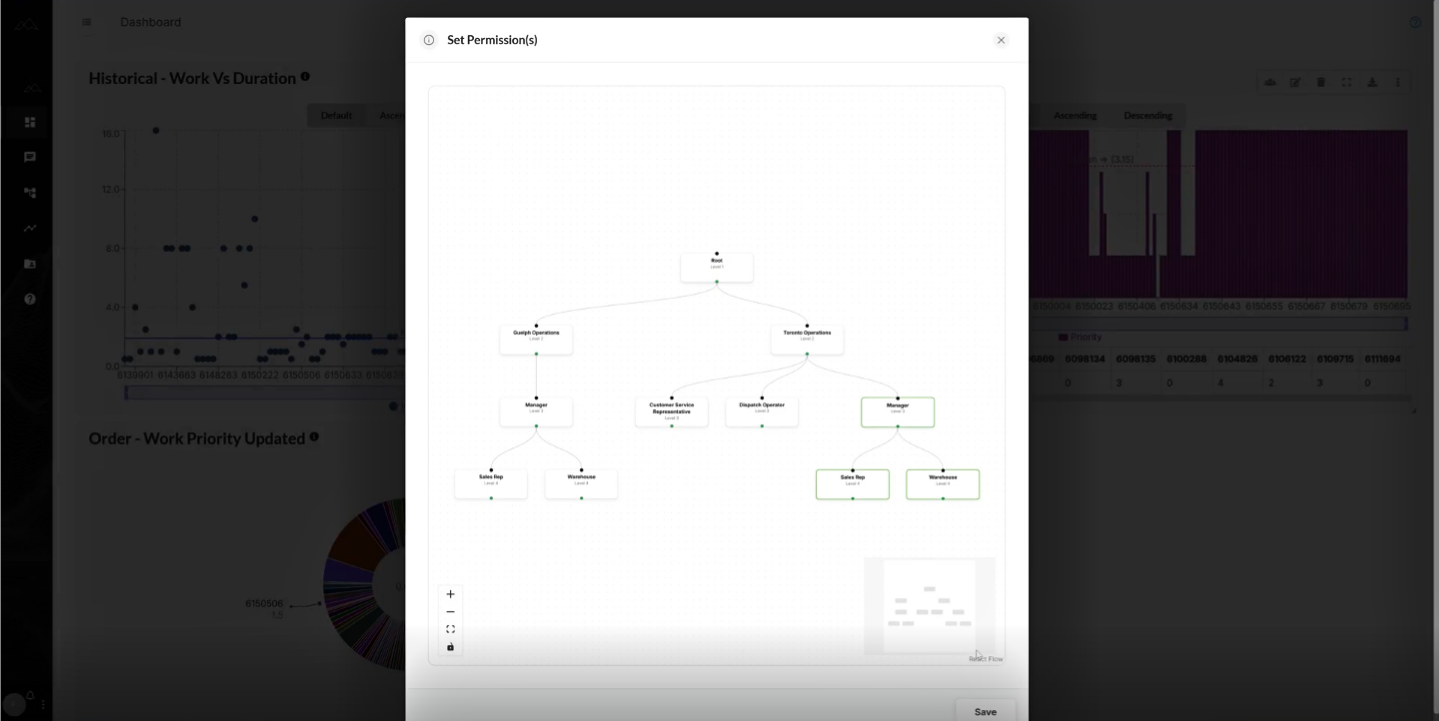
Assigning Permissions to User Dashboards
Dashboards aren’t one-size-fits-all. DataPeak uses a role-based permissions model so users only see the data relevant to them.
Standard users can view dashboards tied to their permission group.
Depending on assigned permissions, some admin-level features may also apply.
This balance of control and flexibility ensures that teams have the insights they need and nothing they shouldn’t.
Customizing the Dashboard Look & Feel
One of the biggest frustrations with legacy systems is rigid, one-size-fits-all dashboards. DataPeak takes the opposite approach with a no-code customization philosophy.
Every user can:
Rearrange graphs to match their workflow.
Resize or shrink graphs based on priority.
Create personal layouts without affecting anyone else’s dashboard.
It’s as intuitive as rearranging widgets on a phone screen, no technical skills required.

Functionality for All Users
Even without admin privileges, DataPeak dashboards come with powerful features:
Resize and organize graphs to highlight what matters most.
Download graphs in multiple file formats for reporting.
Generate embed codes to share dashboards externally.
Show or hide summary tables for deeper analysis.
This democratizes access to insights, ensuring every team member, from the production floor to the executive suite, can work smarter.

From Visualization to Action with Agentic AI
Data visualization alone doesn’t solve problems. What makes the DataPeak dashboard unique is how it connects directly to agentic AI workflows. Graphs don’t just display numbers; they trigger automated, intelligent responses.
Examples include:
Manufacturing: Predictive maintenance alerts flag anomalies in automotive assembly lines before breakdowns occur.
Public sector: Dashboards track spending thresholds, alerting leaders to budget risks in real time.
Food processing: Quality teams see defect rates spike and trigger automated workflows to isolate issues.
Instead of waiting for a monthly report, teams act on insights the moment they appear.
Pro Tips: Getting the Most Out of DataPeak Dashboards
Want to go beyond the basics? Here are some ways to maximize your dashboard’s impact:
Group graphs by workflow: Keep related KPIs together for context.
Use threshold lines: Automate alerts when metrics cross critical thresholds.
Embed dashboards externally: Share real-time insights with stakeholders outside your system.
Prioritize layout by importance: Resize graphs to emphasize your most critical KPIs.
Small adjustments make dashboards more actionable and reduce time wasted digging for answers.
How DataPeak Dashboards Compare to Traditional BI
Legacy BI dashboards provide static views of the past. They’re valuable for historical reporting but fall short when speed and adaptability are required.
DataPeak dashboards are built differently:
No-code customization means anyone can adapt dashboards instantly.
Agentic AI integration ensures dashboards don’t just inform, they initiate action.
Multi-mode data support makes it possible to blend structured and unstructured data in one view.
This shift from “reporting” to “real-time operations” is why organizations in manufacturing and the public sector are moving beyond BI to agentic AI-powered platforms.
FAQ: DataPeak Dashboards
Q: How are DataPeak dashboards different from BI dashboards?
A: Traditional dashboards report on past data. DataPeak dashboards combine visualization with agentic AI workflows that act on insights in real time.
Q: Do users need technical skills to customize dashboards?
A: Not at all. Dashboards are fully no-code, allowing every user to resize, rearrange, and personalize layouts.
Q: Can dashboards connect to automated workflows?
A: Yes. Dashboards don’t just display numbers, they trigger workflows, predictive alerts, and AI-driven actions.
Q: What industries benefit most from DataPeak dashboards?
A: We see strong adoption in manufacturing, automotive, food processing, and public sector workflows.
Dashboards Designed for Decision Makers
Blockbuster failed because it ignored change. Modern organizations don’t have that luxury.
The DataPeak dashboard goes beyond visualization to deliver scalable automation, no-code customization, and AI-driven insights. It gives decision makers in manufacturing, automotive, and the public sector the agility they need to thrive in a world defined by disruption.
Ready to see it in action? Watch the full video or book a walkthrough to explore how DataPeak can transform your workflows.
Keyword Profile: DataPeak dashboard, DataPeak Agentic AI, DataPeak no-code AI, no-code data visualization, workflow automation dashboards, predictive analytics dashboards, AI-powered dashboards, agentic AI workflows