
How to Use Custom AI Agent Components
Your central reference for every component used to build Custom Agents in DataPeak.
Custom Agents let you design automated workflows using a drag‑and‑drop canvas. Components bring data in, clean and transform it, call LLMs, visualize results, and deliver outputs — all without writing code. This guide shows you how to use each component, step by step, and includes copy‑ready workflows you can reproduce in the Agent Builder.
1. Quick Start
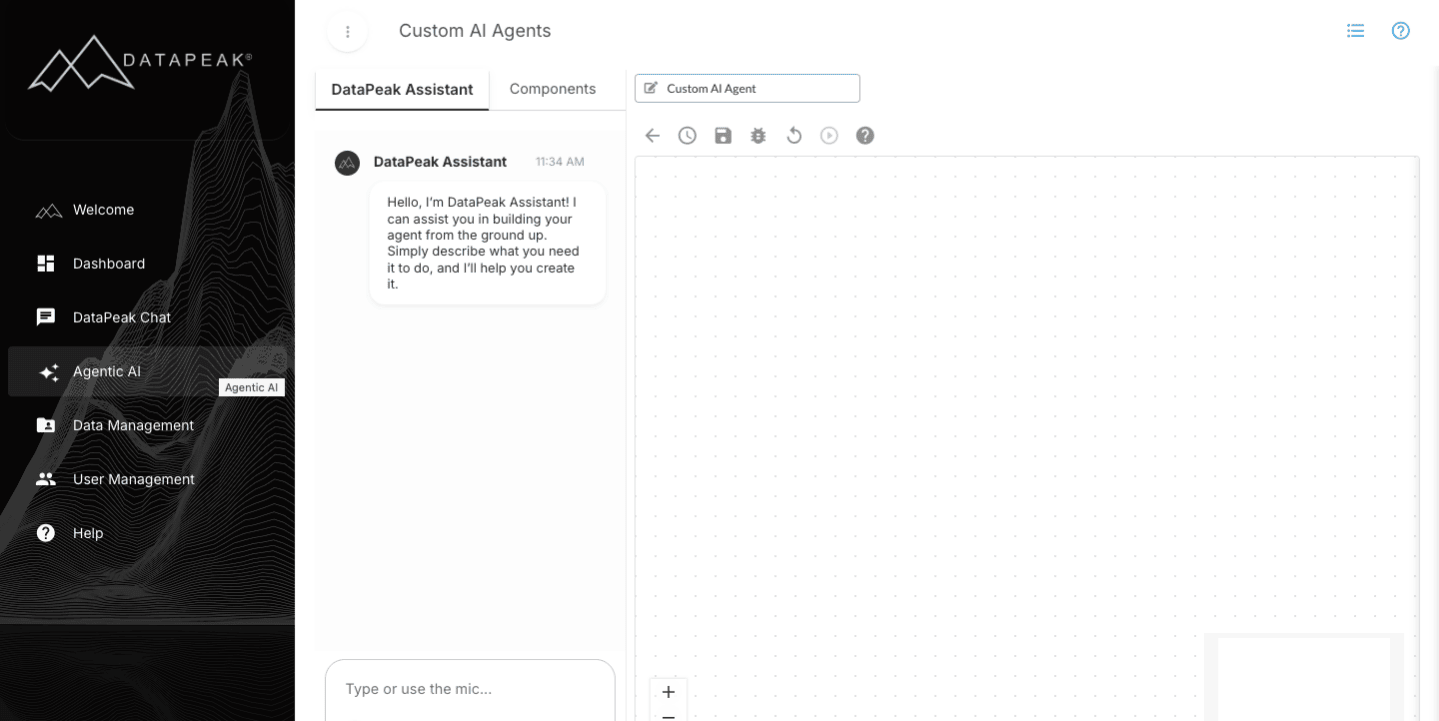
Create a new Custom Agent through the Agentic AI page
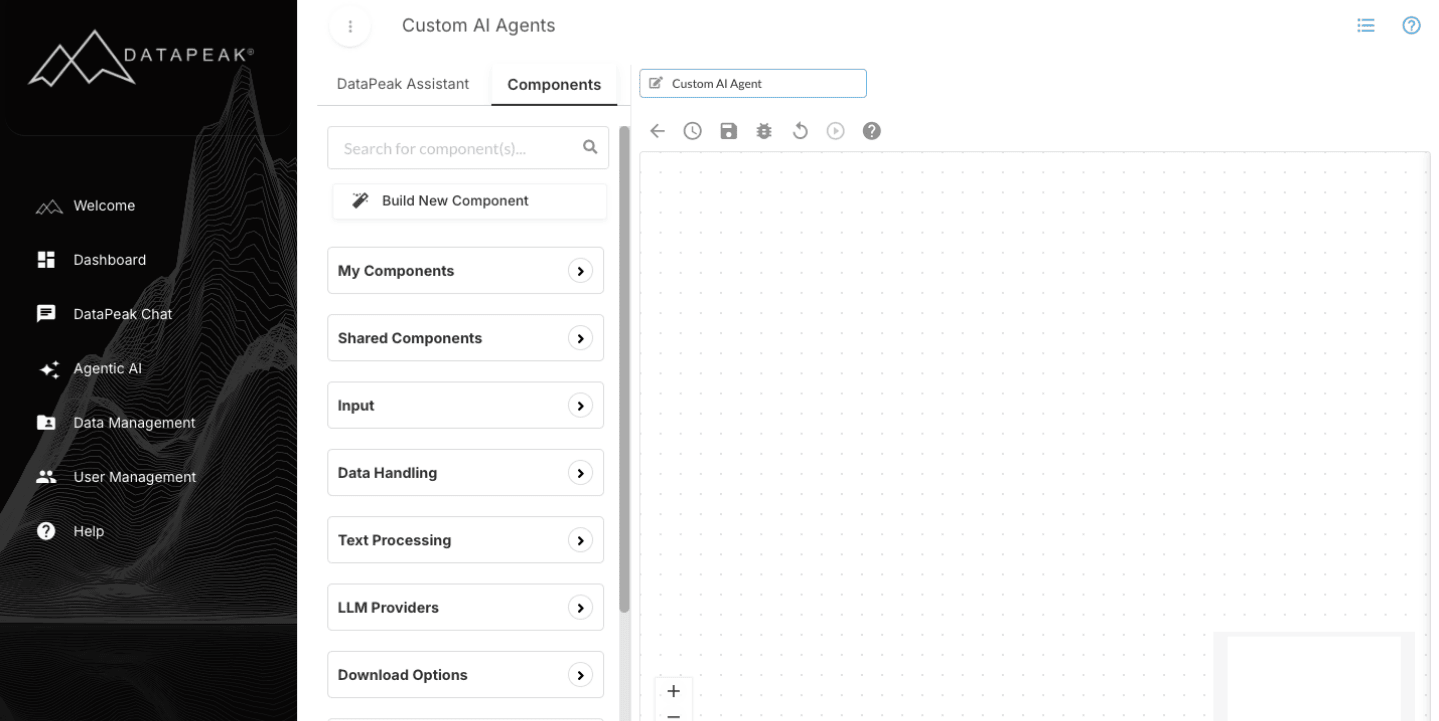
Either request for an agent through the “DataPeak Assistant” or use the Components tab to drag and drop the components onto the workflow
Workflows should start with an Input component and end with an Output component, with any number of components in between
2. How this page is organized
Usage: What the component(s) are used for.
Parameters: The configuration needed for the component.
How to use: Workflow setup to use the component.
Examples: Workflows that can be made with the component.
3. Components
My Components
Custom Components
API tokens control access to Output APIs.
A token must be generated before testing or using an API.
Usage: For unique components generated by the system for personal or business use
Parameters: Dataset(s), Component Name, Icon, Category, Description
How to use:
Click on the Build New Component button, then it will create a new component on the canvas.
Click on the Parameters button on the new component, which will open a modal for the chat interface.
Select dataset(s), set the component name, category and use the chat to give instructions.
Once a plan is generated then you can use it to generate code to perform the requested actions on the data.
Click on the generate code button and then the Preview button to see the results.
If the results are correct, save the component.
Examples: If the user does not find any component that performs a certain task, then the user can use this to create new component.
Input Components
Input
Usage: Select one or multiple datasets connected to the system and use it in the agent workflow.
Parameters: Dataset(s)
How to use:
Select dataset(s) from the dropdown.
Connect the input to later components.
Examples: An input component will nearly always be at the start of every agent.
Data Connectors (Microsoft, Harvest, Azure Blob Storage...)
Usage: Select existing datasets created through cloud connectors.
How to use:
Select dataset(s) from the dropdown (if already created) .
Connect the input to later components.
If user wants to configure new connection click on configure new connection and using that create datasets then select dataset(s).
Examples: Connect your data stored on Microsoft OneDrive to the system.
Data Handling
LIDA (Auto Analysis) Output
Usage: Generates visualizations and infographics using LLMs for datasets.
Parameters: Number of Goals
How to use:
Select Data Handling from the dropdown.
Select and drag LIDA (Auto Analysis) Output.
Connect to input.
Select parameters.
Enter in Number of Goals.
Examples: Generate financial comparisons between different companies within an Excel file.
LIDA (Auto Analysis) Goals
Usage: Generates possible questions about provided datasets.
Parameters: Number of Goals
How to use:
Select Data Handling from the dropdown.
Select and drag LIDA (Auto Analysis) Goals.
Connect to input.
Select parameters.
Enter in Number of Goals.
Examples: Generate a set of questions that an average user would ask about a PDF document, such as major determining factors between different manufacturing plants causing improved production levels.
Iterator
Usage: Loops through multiple different datasets to apply repeated component actions to the results of the component.
Parameters: Array Data and Process Each Item Using
How to use:
Select Data Handling from the dropdown.
Select and drag Iterator.
Connect to input.
Select parameters.
Array Data should select your Input dataset.
Examples: If you have 10 csv files and would like to run one LLM Prompt component on all of them with the same parameters, you use the iterator.
LLM Prompt Engineering
Usage: Using prompts provided by the user, performs actions on the dataset provided.
Parameters: Custom Prompt
How to use:
Select Data Handling from the dropdown.
Select and drag LLM Prompt Engineering.
Connect to input.
Select parameters.
Enter your custom prompt.
Examples: Users can request a financial report analysis of the data.
Text Processing
Summarization
Usage: Using LLMs summarizes the data provided in a simple manner.
Parameters: NONE
How to use:
Select Text Processing from the dropdown.
Select and drag Summarization.
Connect to input.
Examples: Explaining the main points of a complex legal document.
Keywork Extraction
Usage: Extracts important keywords from data provided.
Parameters: NONE
How to use:
Select Text Processing from the dropdown.
Select and drag Keyword Extraction.
Connect to input.
Examples: Retrieving the keywords from a project proposal document to determine what main points need to be addressed.
Sentiment Analysis
Usage: Determines the emotional tone of voice of provided text to help understand public opinion, customer feelings and brand reputation.
Parameters: NONE
How to use:
Select Text Processing from the dropdown.
Select and drag Sentiment Analysis.
Connect to input.
Examples: Using a statement provided by an advertising company, determine what the most likely emotional response for that statement would be.
LLM Providers
Provider Options (Amazon, Anthropic, Cohere, DataPeak, DeepSeek, Meta, Mistral AI, OpenAI)
Usage: Allows for attaching the expected LLM to use as part of LLM-based components.
How to use:
If the component uses LLM, then you will see the attached plus icon below the node.
User can click on plus icon and select the LLM and the model from that or leave that empty in that case by default it will run based on DataPeak LLM.
Examples: Attach the provider you prefer to an LLM component.
Download Options
Downloader Options (PDF, CSV, Word, Powerpoint)
Usage: Allows direct downloading of data provided by previous components in the attached format.
Parameters: File Name
How to use:
Select Download Options from the dropdown.
Select and drag input (PDF, CSV, Word, Powerpoint).
Connect to input.
Select parameters.
Enter file name.
Examples: Download the results of the Powerpoint Generator component with the Powerpoint output.
Output
Save As Dataset
Usage: Saves component output as a dataset on the system.
Parameters: Dataset Name
How to use:
Select Output from the dropdown.
Select and drag Save As Dataset.
Connect to input.
Select parameters.
Enter dataset name.
Examples: After cleaning the data and merging it with other files, save the dataset for later usage in the system.
Graph Output (Pie, Radar, Scatter, Area, Line, Bar)
Usage: Generates a graph based on the data provided by previous components.
Parameters: Horizontal Axis, Vertical Axis, and Use Stacked Graph
How to use:
Select Output from the dropdown.
Select and drag Graph Output.
Connect to input.
Select parameters.
Enter horizontal axis, vertical axis, and use stacked graph.
Examples: Using xlsx files containing financial data, generate a graph that shows depreciation over time.
Notifications
Usage: Emails component output to a set email address.
Parameters: Recipients and Subject
How to use:
Select Notifications from the dropdown.
Select and drag Email.
Connect to input.
Select parameters.
Enter recipients and subject.
Examples: After generating forecasts based on sales data, send the forecasts to an approved financial team through email.
Data Transformation
Web Search
Usage: Searches the web based on relevant information based on the data provided.
Parameters: Web Search Query or Prompt
How to use:
Select Data Transformation from the dropdown.
Select and Web Search.
Connect to input.
Select parameters.
Enter web search query or prompt.
Examples: Gathers information on business rivals for product data and how sales are performing for other companies.
Data Cleaner
Usage: Cleans csv data for misaligned columns due to incorrect column separator placement.
Parameters: NONE
How to use:
Select Data Transformation from the dropdown.
Select and Data Cleaner.
Connect to input.
Select parameters.
Enter web search query or prompt.
Examples: For incorrect csv data, cleans the misaligned columns for later usage in the system.
HTML Value Parser
Usage: Processes JSON data that includes HTML content.
Parameters: Column Contains HTML Content
How to use:
Select Data Transformation from the dropdown.
Select and HTML Value Parser.
Connect to input.
Select parameters.
Select column that contains html value.
Examples: When input is having column that holds html use this to get the actual values from those html tags.
Group JSON
Usage: Groups JSON objects together using a key and combines the objects together.
Parameters: Group by Column Key and Aggregation
How to use:
Select Data Transformation from the dropdown.
Select and Group JSON.
Connect to input.
Select parameters.
Select and enter group by column key and aggregation.
Examples: Converts the JSON to an object by grouping using some key selected by users under parameters
Translation
Usage: Translates provided data into selected languages.
Parameters: based on the selected input file it will ask for page number or column name that needs to translate
How to use:
Connect this component after any input type component.
Click on parameters button and select the appropriate parameters.
Examples: Convert a PDF, Word or Excel file from English to French.
Image Annotation
Usage: Allows the user to add annotations to images to analyze the images for possible defects or issues.
Parameters: LLM Image Annotation
How to use:
Select Data Transformation from the dropdown.
Select Image Annotation.
Connect to input.
Select parameters.
Enter LLM Image Annotation.
Examples: User has images of parts of cars, use this component to find scratches, dents or any kind of defects.
Powerpoint (PPTx) Generator
Usage: Generates a powerpoint presentation based on the dataset attached and the prompt provided by the user.
Parameters: Text prompt, number of slides
How to use:
Select Data Transformation from the dropdown.
Select Powerpoint (PPTx) Generator.
Connect to input.
Select parameters.
Enter prompt, number of slides, etc.
Examples: Connect to any input text dataset or give a topic on which user wants to generate power point slide and give how many slides user want it will generate ppt.
Data Merger
Usage: Combines multiple datasets together into a single file.
Parameters: Primary Data and Key from Input.
How to use:
Select Data Transformation from the dropdown.
Select Data Merger.
Connect to input.
Select parameters.
Select primary data and key from input.
Examples: User can merge 2 or more datasets together based on columns and then save merged dataset as new dataset.
Dynamic Column
Usage: For csv, xlsx or xls files, allows for creating a new column by combining and transforming existing columns.
Parameters: Column Name, Operation, and Use Columns.
How to use:
Select Data Transformation from the dropdown.
Select Dynamic Column.
Connect to input.
Select parameters.
Enter column name, operation, and use columns.
Examples: If any dataset user wants to combine multiple columns together like date and time use this component to combine that.
JSX Attribute Retrieval
Usage: Pulls data from JSX component strings.
Parameters: Select Key That Has JSX Component
How to use:
Select Data Transformation from the dropdown.
Select JSX Attribute Retrieval.
Connect to input.
Select parameters.
Select key that has JSX component.
Examples: If a dataset has jsx ( react component ) use this to parse that big jsx element and parse the text from that.
Video Annotation
Usage: Allows the user to add annotations to videos to analyze the images for possible defects or issues.
Parameters: NONE
How to use:
Select Data Transformation from the dropdown.
Select Video Annotation.
Connect to input.
Examples: From a manufacturing plant if a user can provide final products in the form of a recorded video, this component gives user flexibility to select the frames where user wants to analyze any defects and helps to find defects easily.
Column Appender
Usage: Combines data through appending data from one column into another column.
Parameters: Provide Inputs
How to use:
Select Data Transformation from the dropdown.
Select Column Appender.
Connect to input.
Select Parameters.
Provide inputs.
Examples: If user has 2 datasets related to each other and user wants best matching value of first datasets column values with second file column use this component.
Data Relationship Comparison
Usage: Finds relationships between JSON data objects.
Parameters: Select Primary File
How to use:
Select Data Transformation from the dropdown.
Select Data Relationship Comparison.
Connect to input.
Select Parameters.
Select Primary File.
Examples: from secondary file component find the relationship with the values from primary file and gives complete match or partial match along with the path.
Column Filter
Usage: Filters or remove columns from csv, xlsx or xls data.
Parameters: Select Columns to Hide
How to use:
Select Data Transformation from the dropdown.
Select Column Filter.
Connect to input.
Select Parameters.
Select Primary File.
Examples: In the tabular datasets if user wants to hide non required columns user can use this component to trim those columns.
Field Replace
Usage: Replace data from one dataset with data from another dataset. Works with csv, xlsx and xls data.
Parameters: Select File to Take Reference, Select Key That Has Values, and File to Take Reference.
How to use:
Select Data Transformation from the dropdown.
Select Field Replace.
Connect to input.
Select Parameters.
Select file to take reference, key that has values, and file to take reference.
Examples: If user has data bar code values in one dataset and in second dataset it has values of those barcodes, user can use this component to replace barcode with actual product name in first dataset.
Structured Data Converter
Usage: Transforms multiple layers of JSON data and flattens them into a single layer of data.
Parameters: NONE
How to use:
Select Data Transformation from the dropdown.
Select Structured Data Converter.
Connect to input.
Examples: If user has objects inside objects (complicated nested object) use this to flatten that object into one object has all key value pairs.
Supply Chain Management
Inventory & Stock Management
Usage: Using provided inventory data, determine the amount of stock for products that’s safe and when to re-purchase inventory when it runs low.
Parameters: Unique Item Identifier, Demand Identifier, and Date Identifier.
How to use:
Select Supply Chain Management from the dropdown.
Select Inventory & Stock Management.
Connect to input.
Select Parameters.
Enter unique item identifier, demand identifier, and date identifier.
Examples: Use this component to get Safety stock values and re-order point (ROP) values.
Expiration Date Tracker
Usage: Tracks expiration dates for inventory and notifies users when inventory is soon expiring.
Parameters: Unique Item Identifier, Demand Identifier, and Date Identifier.
How to use:
Select Supply Chain Management from the dropdown.
Select Expiration Date Tracker.
Connect to input.
Select Parameters.
Enter unique item identifier, demand identifier, and date identifier.
Examples: If a user has a tabular data that has a column that holds an expiry date, then user can directly get list of all the items that will expire soon or the time duration selected by user.
Prediction
ARIMA Forecast
Usage: Forecasts historical data using the ARIMA modal.
Parameters: Unique Item Identifier, Demand Identifier, Date Identifier, and Forecast For Number of Days.
How to use:
Select Prediction from the dropdown.
Select ARIMA Forecast.
Connect to input.
Select Parameters.
Enter unique item identifier, demand identifier, date identifier, and forecast for number of days.
Examples: If user has historical sales/demand data and want to generate forecast based on moving average model user can use this to generate forecast.
Weather Correlation
Usage: Compares weather patterns to metrics to determine correlations between them.
Parameters: Location Column, Weather Variables, SKU Column, Target Value Column, Date Identifier Column, and Date Format.
How to use:
Select Prediction from the dropdown.
Select Weather Correlation.
Connect to input.
Select Parameters.
Enter location column, weather variables, SKU column, target value column, date identifier column, and date format.
Examples: If the user has sales/demand data of products along with location, user can calculate the dependency of the sales/demand trends on weather like moisturizer sales more in the winter season.
Remaining Useful Life (RUL) Prediction
Usage: Using provided data, predicts the time left for machinery until failure.
Parameters: Vibration Signal and Select Models
How to use:
Select Prediction from the dropdown.
Select Remaining Useful Life (RUL) Prediction.
Connect to input.
Select Parameters.
Enter vibration signal and select models.
Examples: From any sensors data (vibration signals of bearings) if the user wants to predict the remaining useful life of equipment.
ML Forecast Model Recommender
Usage: Based on the dataset provided, recommends the best option for forecast modal that will provide the most useful information.
Parameters: Unique Item Identifier, Metric to Forecast, Date identifier column, Date Format (for parsing), and Forecast Frequency
How to use:
Select Prediction from the dropdown.
Select ML Forecast Model Recommender.
Connect to input.
Select Parameters.
Enter unique item identifier, metric to forecast, date identifier column, date format (for parsing), and forecast frequency.
Examples: Based on the historical data, this component will check the patterns and use ML to find the best model to generate forecasts. It will compare multiple models and check the accuracy then give final suggestions.
ML Forecast
Usage: Generates forecasts based on historical datasets provided using machine learning.
Parameters: ML Forecast Information Columns
How to use:
Select Prediction from the dropdown.
Select ML Forecast.
Connect to input.
Select Parameters.
Input ML Forecast Information Columns.
Examples: based on the input historical data if the user wants to generate forecast, select the model and use this component to get forecast values.
ML Forecast Comparator
Usage: Compares forecast results from multiple machine learning models on a historical dataset to determine which results are the most accurate.
Parameters: ML Forecast Comparator Information Columns.
How to use:
Select Prediction from the dropdown.
Select ML Forecast.
Connect to input.
Select Parameters.
Input ML Forecast Comparator Information Columns.
Examples: Use this component to do comparison of multiple models on forecast values accuracy.