
How To Chat With Your Data In DataPeak
Ask questions, explore datasets, and generate insights using natural language.
DataPeak lets you talk directly to your data using simple questions. Instead of building filters or dashboards manually, you can explore a dataset conversationally inside the Chat window.
This guide focuses only on how to chat with your data, for users who want fast insights without exploring the full Chat feature set.
To learn more about DataPeak Chat Menu and it’s features, click here.
1. Open DataPeak Chat
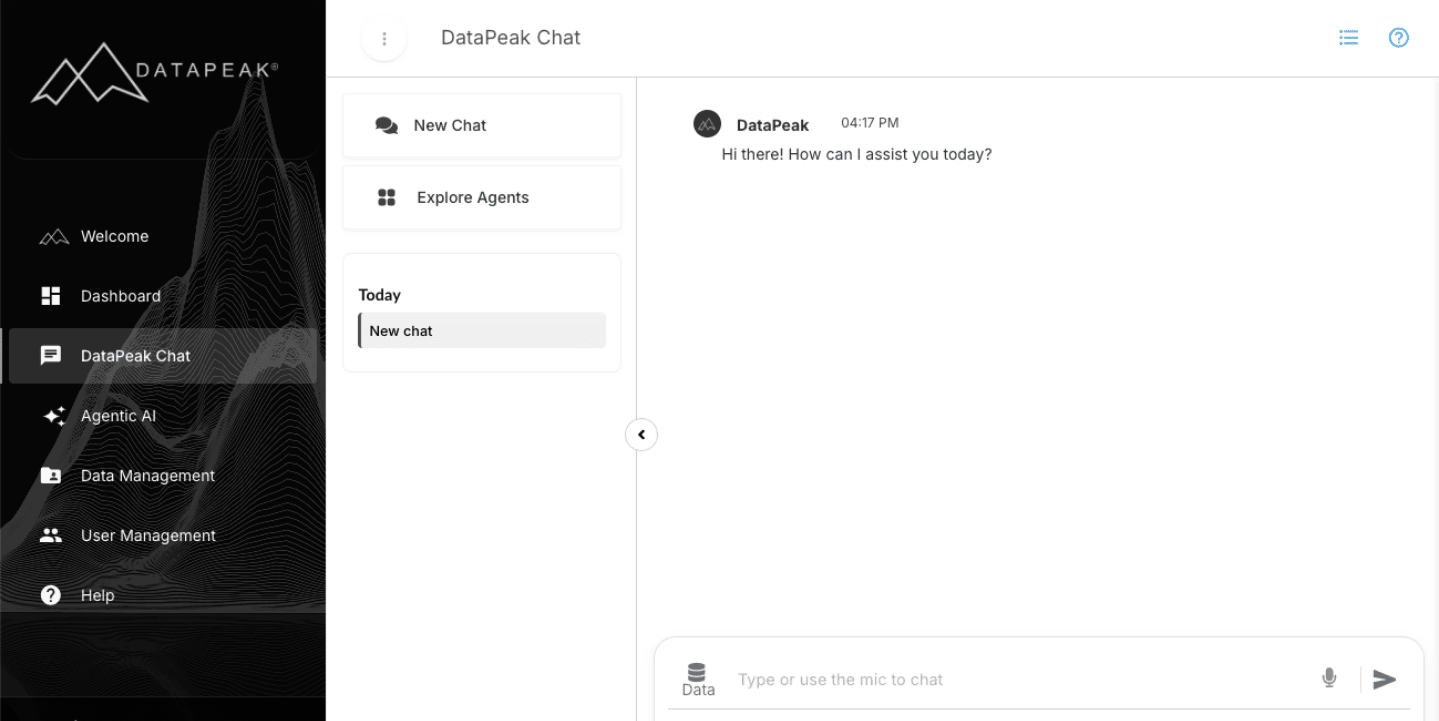
Sign in to DataPeak.
Click DataPeak Chat in the left sidebar.
Click New Chat if you want a clean session.
Your most recent dataset may load automatically.
2. Select or Add a Dataset
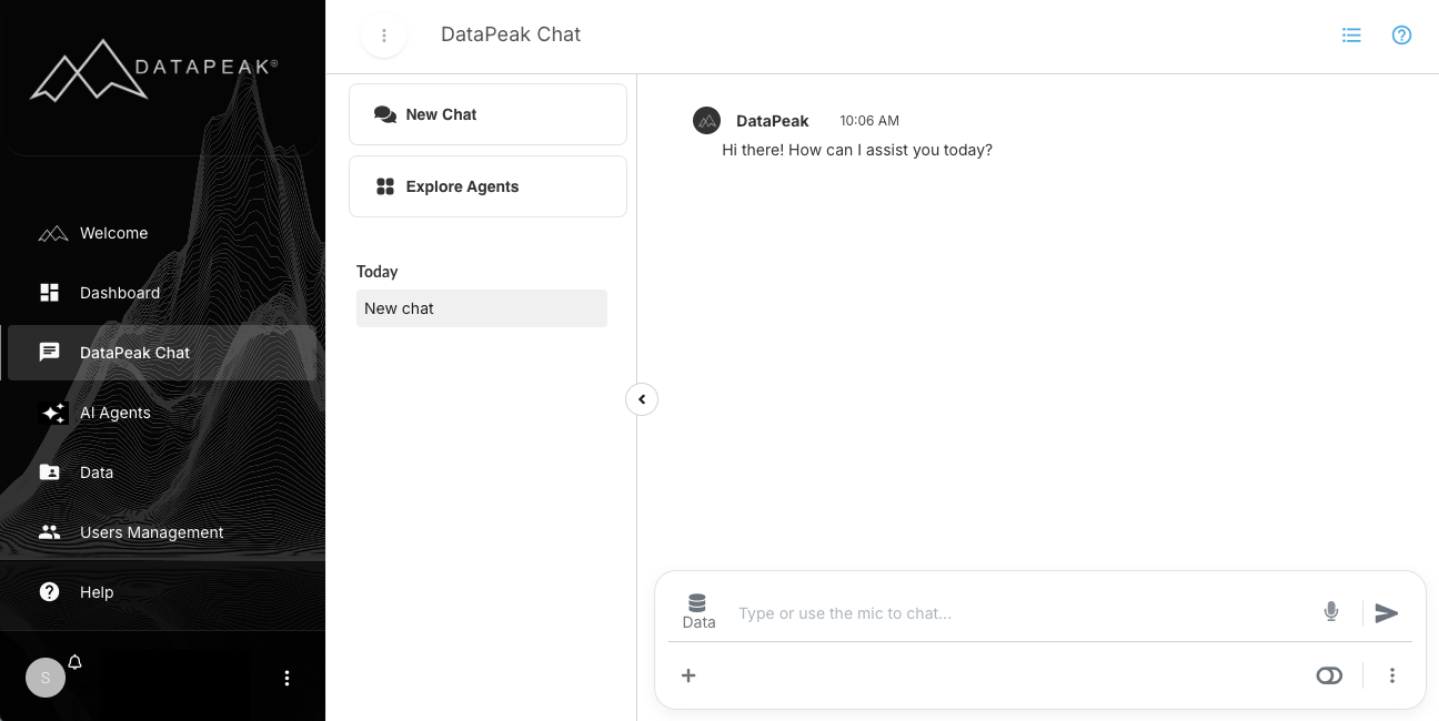
To start chatting with your data, choose the dataset you want to explore.
To add a dataset to the session:
Click the plus icon (+)
Upload or choose a dataset
Once a dataset is selected, Chat can answer questions about it.
3. Ask Questions About Your Data
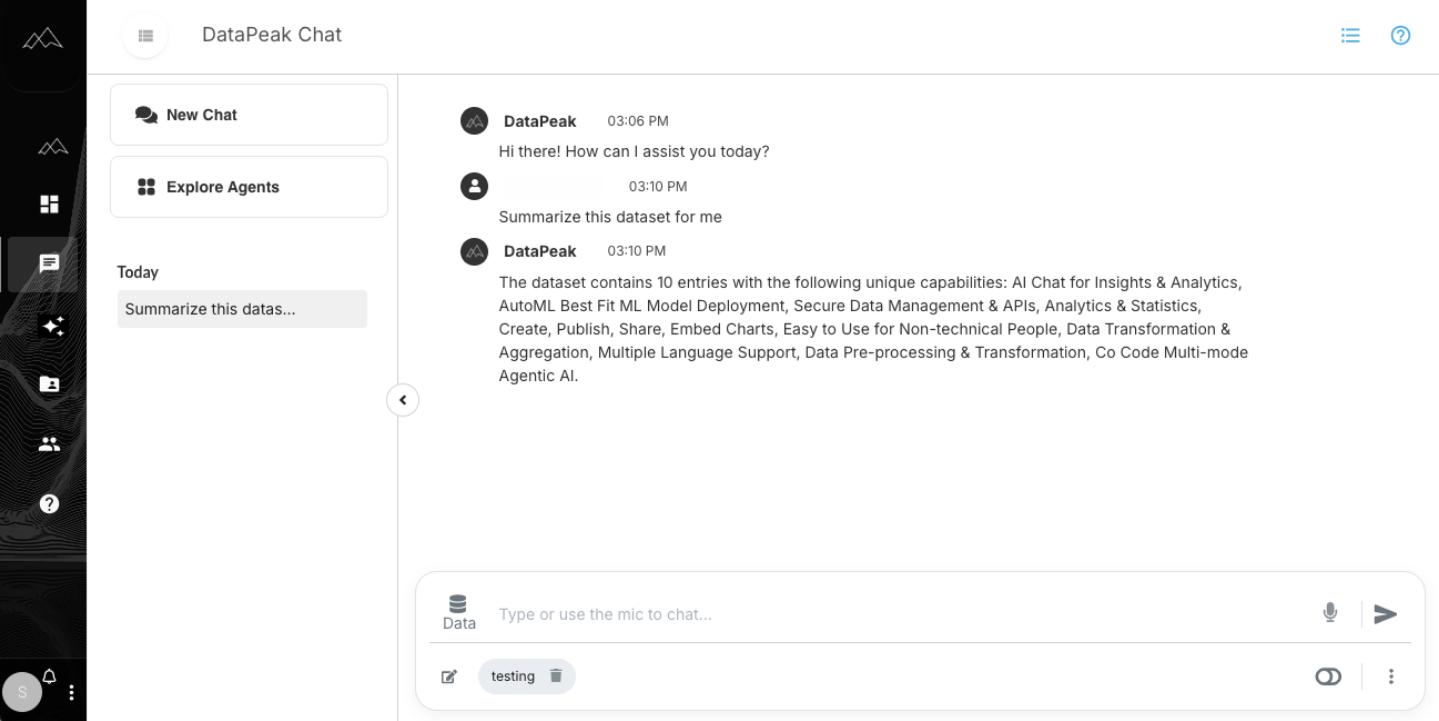
You can ask questions in plain language.
Examples:
“Show a table of everything in this dataset.”
“Filter this to the last 6 months.”
“Which category sold the most units?”
“Summarize this dataset for me.”
How to ask:
Type your question in the message box
Press Enter
Chat uses your selected dataset to generate an answer
Follow-up questions let you refine results.
4. Generate Charts & Visuals
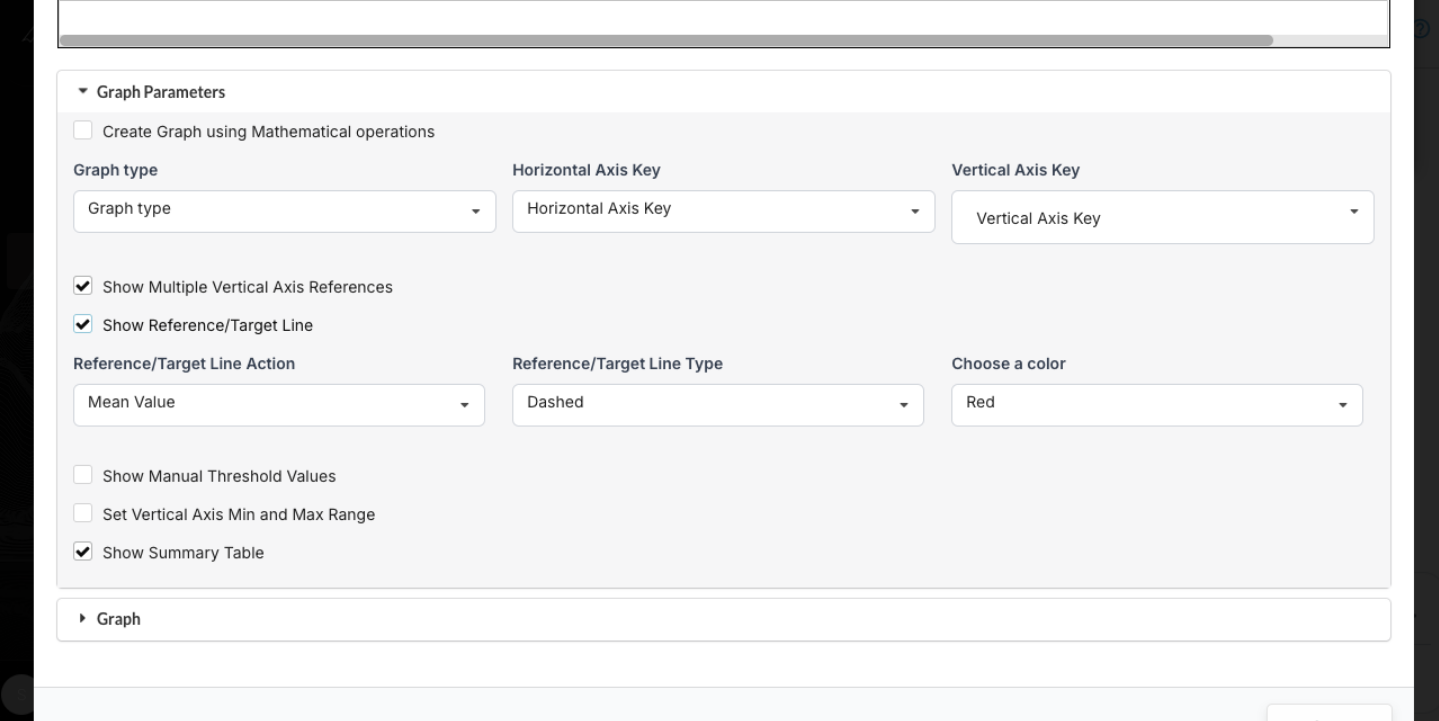
You can use Chat to quickly create visualizations based on your dataset.
Steps:
Confirm or select your dataset
Ask for an advanced graph
Choose your chart type
Select x-axis, y-axis, and any parameters
Click Submit
Chat will generate the chart directly in the conversation.
If the chart is useful, you can save it to your Dashboard using the Save button.
5. When to Use Chat With Your Data
Use this feature when you want to:
Explore a dataset quickly
Run ad-hoc queries
Get immediate summaries
Create quick charts without dashboards
Validate or inspect data before deeper analysis
It’s the fastest way to get answers from your data inside DataPeak.