
How To Use DataPeak Chat
Your conversational command center for exploring data, running workflows, and building agents.
DataPeak Chat lets you interact with your data and agents the same way you’d talk to a teammate. You can ask questions, create workflows, troubleshoot issues, and generate charts, all through natural language.
This guide shows you how to use Chat effectively, including switching modes, creating agents, exploring existing workflows, and managing conversations.
To learn how to chat with your data, click here.
1. What You Can Do in DataPeak Chat
With Chat, you can:
Explore your datasets using natural language
Generate charts and visualizations
Use voice input instead of typing
Access your agent library through Explore Agents
Chat adapts to your workspace and permissions, meaning it can access:
Your datasets
Your agent library
Dashboard metrics
Run history
System-level options (depending on your role)
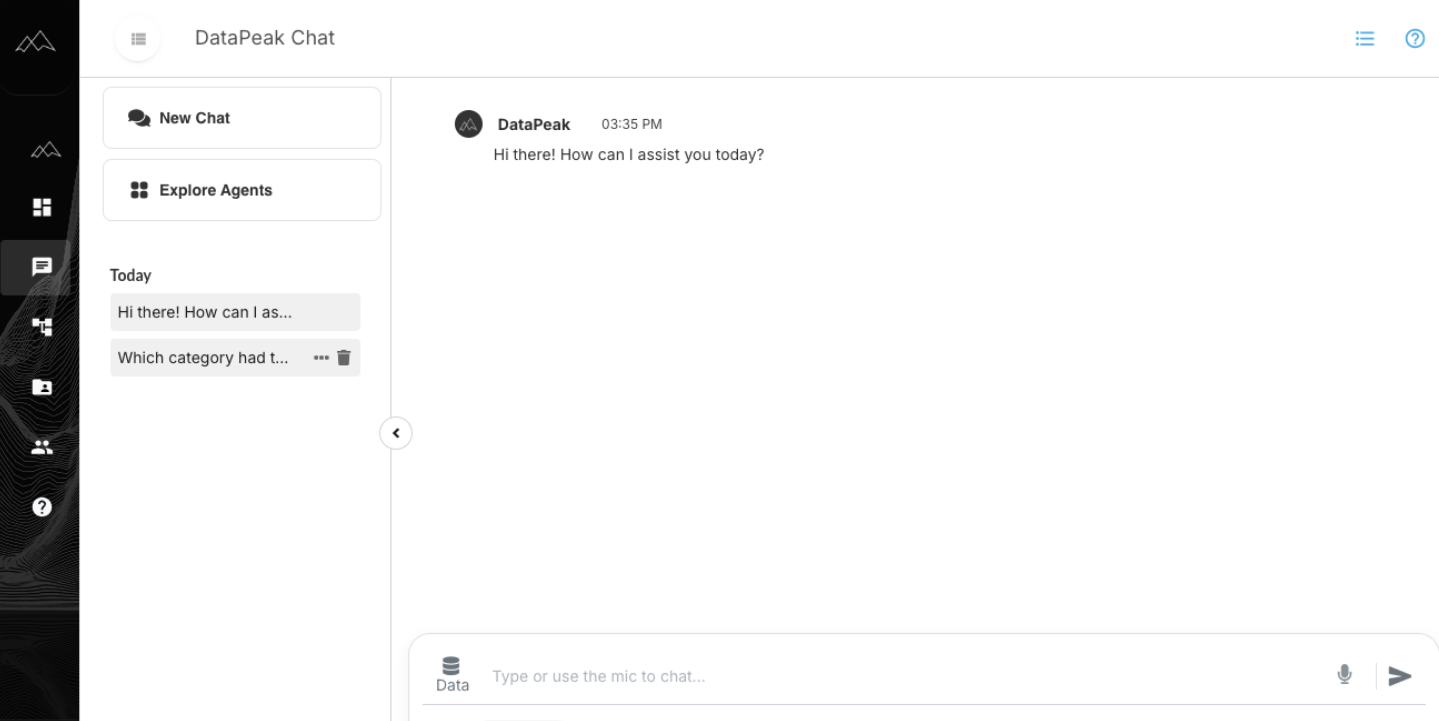
2. The Chat Interface Overview
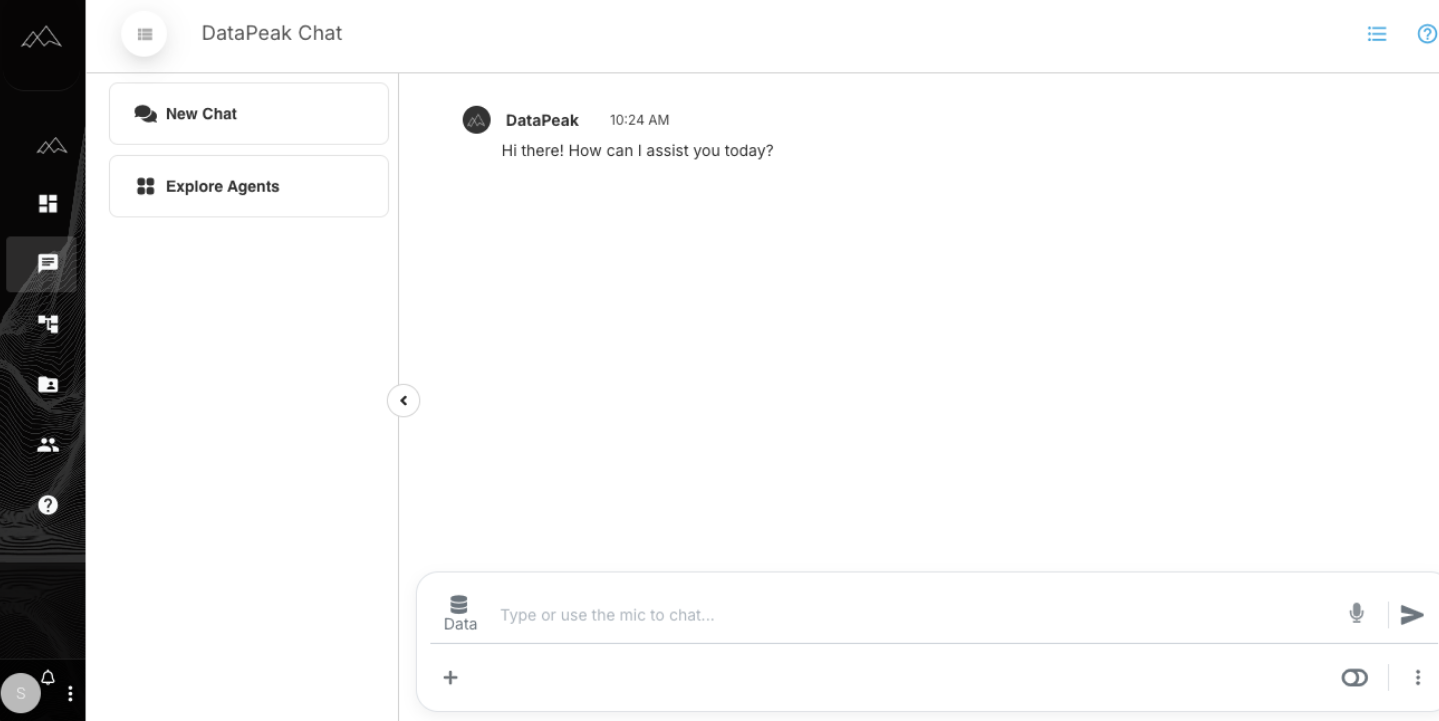
When you open DataPeak Chat, you’ll see:
New Chat — start a fresh conversation
Explore Agents — browse agents sorted by category
Main chat window — where your conversation takes place
Message box — type or speak your request
Dataset selector — choose the dataset for your question
3. Asking Questions About Your Data
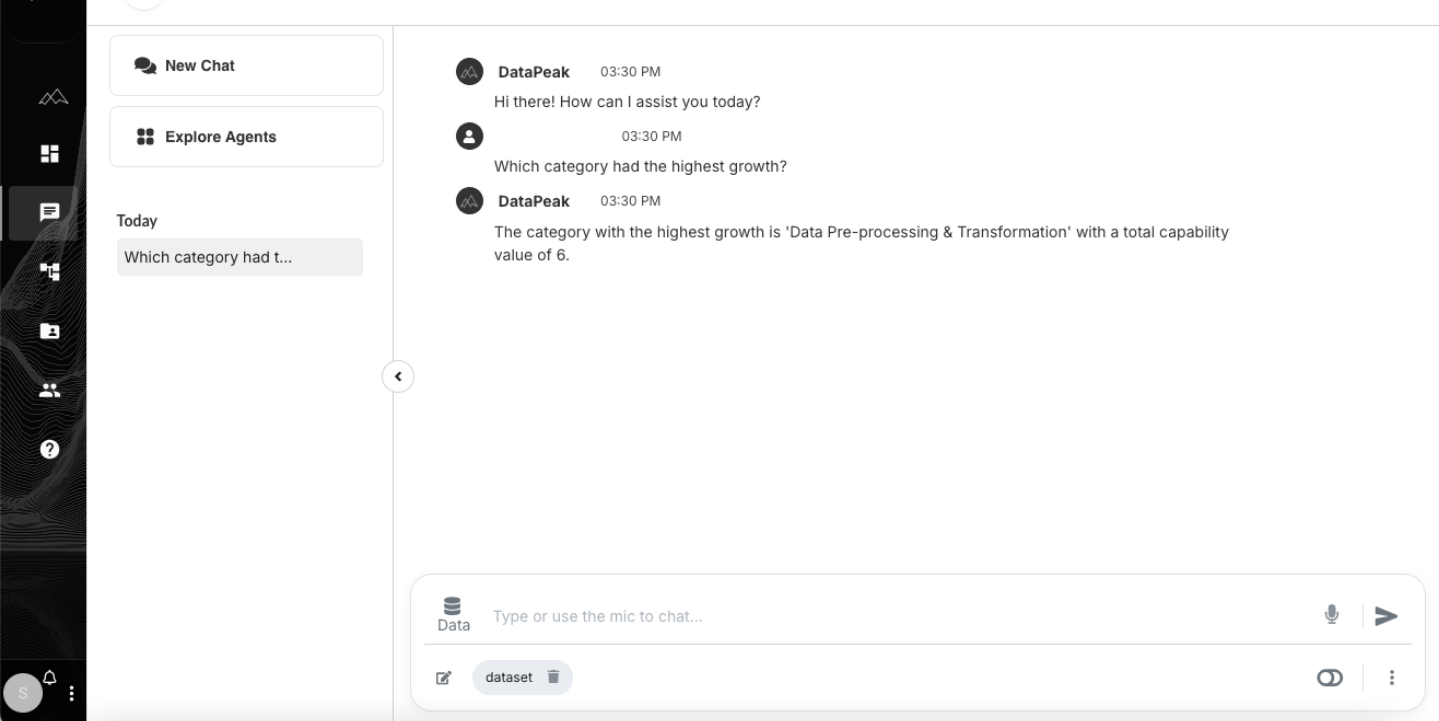
Once you select a dataset, you can ask:
“Show total revenue by month.”
“Which category had the highest growth?”
“Filter records to only show the last 6 months.”
“Create a table of inventory levels by location.”
Chat will respond using the dataset selected at the bottom of the screen.
If no dataset is selected, Chat will prompt you to choose one.
To learn more about how to chat with your data, click here.
4. Creating Charts & Visuals in Chat
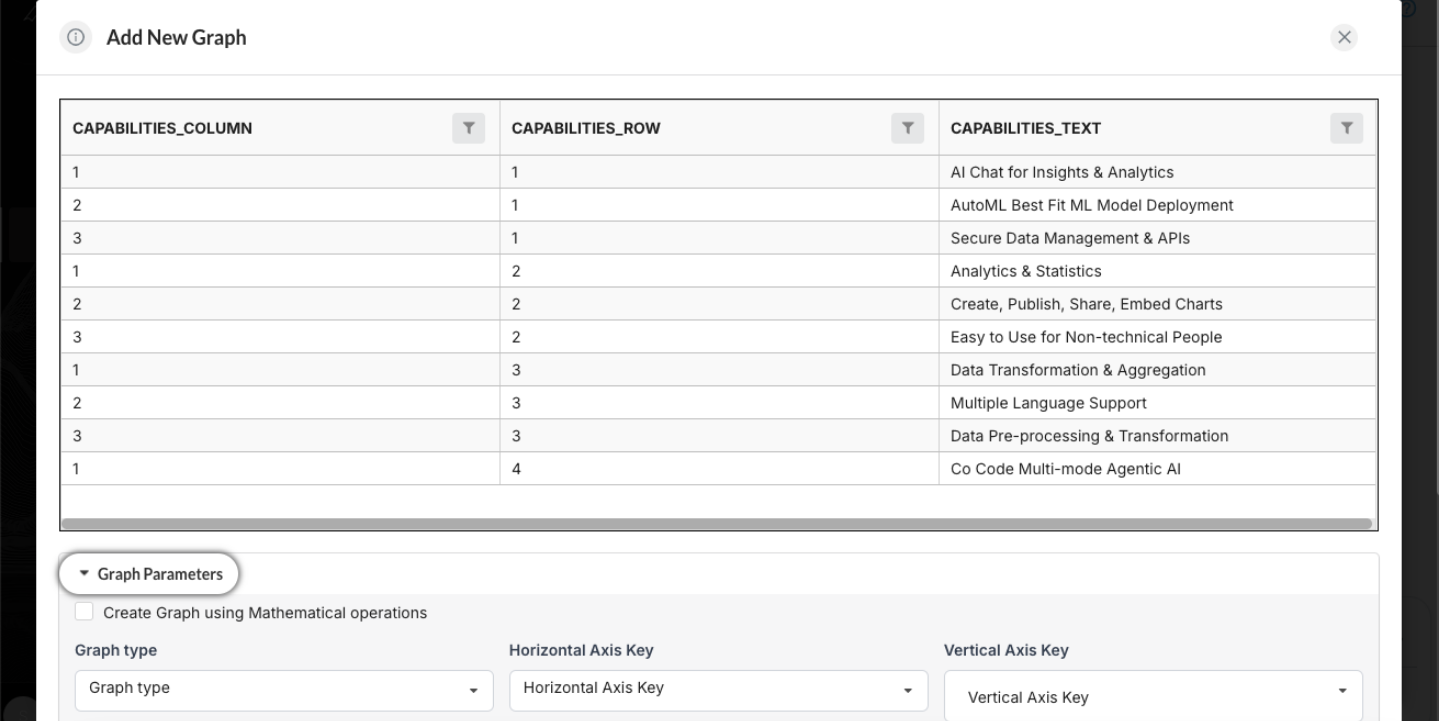
DataPeak Chat can generate visuals directly through the Advanced Graph option.
To create a chart:
Ask for Advanced Graph
Choose your dataset
Pick your chart type (line, bar, scatter, multi-axis, etc.)
Set parameters (x-axis, y-axis, comparisons, filters)
Chat generates the visualization
To save the chart to your Dashboard:
Click the Save button at the bottom-right of the generated chart.
6. Voice Input

If you prefer to speak your requests:
Click the microphone icon in the message bar
Speak your question
Chat will convert your speech to text and execute the command
7. Explore Agents
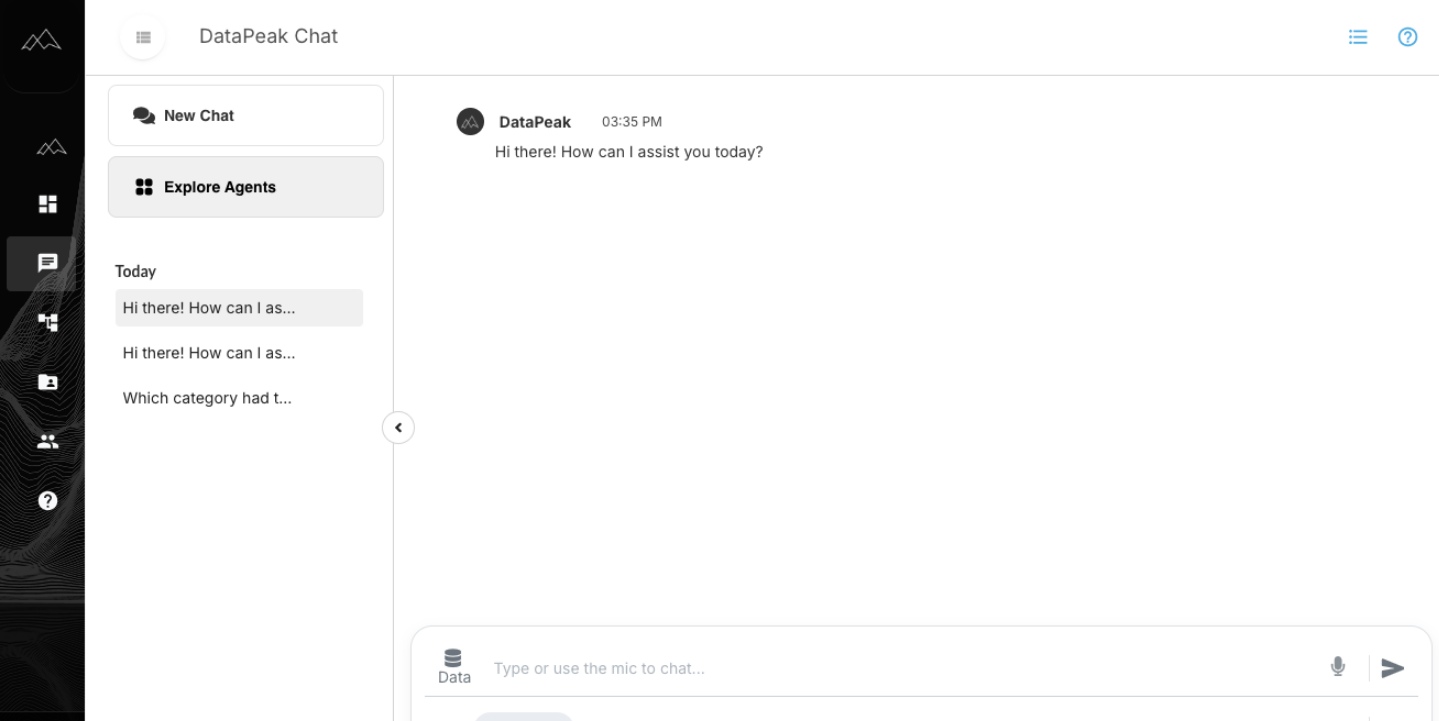
Explore Agents will take you to the Agentic AI section.
Where you can create custom agents or use pre-built system agents, helping you discover agents you can:
View
Run
Reuse
Learn from
You can browse system agents using the menu across the top of the screen by
Using the Search box
Sort by Name or Category
Sort in Ascending or Descending Order
This is ideal for new users who want to see examples or understand what’s possible. Learn more about this in How to Use Agentic AI (insert link)
8. Managing Chat Sessions
Session Persistence
The last chat session automatically loads when you open Chat
The active dataset from your previous session will also load
Viewing Recent Sessions (last 30 days)
Under Explore Agents, you’ll see your recent conversations.
Deleting Chat Sessions
Hover over a saved chat from the last 30 days
Click the trash icon
The conversation is deleted immediately
Cancelling a Query
If Chat is taking too long:
The send icon changes during loading
Click it to cancel the request instantly
This is helpful when you want to rephrase a question or stop a long-running operation.
9. When to Use DataPeak Chat
Use Chat when you want to:
Explore your data naturally